Working with Navigation Meshes
Date Modified: February 21 2025
Navigation meshes are a data structure which encode information about a space in a 3D world. Typically, they’re used for helping bots navigate through that world. Essentially, these navigation meshes are graphs, where a navigable region of the map (a “tile” aka the nodes on the graph) is connected to others (the edges on the graph).
In CS2, a navigation mesh comes in the form of a .nav file. In our library, we provide the navigation mesh information for the most popular maps. If a map is missing, feel free to open up a feature request on Github issues. The map data is found in the Awpy data directory ($HOME/.awpy) after running awpy get navs and awpy get maps (needed below for plotting).
Basic Nav Mesh Functionality in Awpy
The Nav class contains two attributes - version and areas. Version states the version of the nav mesh file. Areas is a dictionary where the key is an integer (specifcally NavArea id) and the value is the NavArea object. All of the NavArea objects for a given map together describe the navigable surfaces for that map (i.e., the nav mesh). In most instances, you will use the Nav class to read from a .json file, which you can get using awpy get navs. You can also use the
Nav class to parse a .nav file by doing Nav("path-to.nav").
[1]:
import awpy.data
import awpy.nav

path_to_nav_file = awpy.data.NAVS_DIR / "de_dust2.json"
dust_2_nav = awpy.nav.Nav.from_json(path=path_to_nav_file)
dust_2_nav
[1]:
Nav(version=35.1, areas=2248)
NavArea object
NavArea object contains a few attributes: id, connected_ids, points, and size). Here is what those attributes mean:
id- integer representing the id for the tile for the mapconnected_ids- ids of NavArea objects/navigation tiles who are connected to the NavArea objectpoints- 4 points describing the shape of the NavArea object/navigation tilesize- size of the navigation tile in the map
A more readable version of a NavArea object can be created by calling NavAreaObject.to_dict(). More info can be found in awpy.nav.
[2]:
print(dust_2_nav.areas[832])
print(' ')
print((dust_2_nav.areas[832].to_dict()))
NavArea(id=832, connected_ids=[747, 828, 876, 919, 941, 975], points=[(1618.9998779296875, 710.9998168945312, 84.00000762939453), (1589.0, 710.9998168945312, 84.00000762939453), (1589.0, 343.499755859375, 84.00000762939453), (1618.9998779296875, 343.499755859375, 84.00000762939453)], size=11024.956970207393)

{'area_id': 832, 'hull_index': 0, 'dynamic_attribute_flags': 0, 'corners': [{'x': 1618.9998779296875, 'y': 710.9998168945312, 'z': 84.00000762939453}, {'x': 1589.0, 'y': 710.9998168945312, 'z': 84.00000762939453}, {'x': 1589.0, 'y': 343.499755859375, 'z': 84.00000762939453}, {'x': 1618.9998779296875, 'y': 343.499755859375, 'z': 84.00000762939453}], 'connections': [941, 828, 747, 876, 919, 975], 'ladders_above': [], 'ladders_below': []}
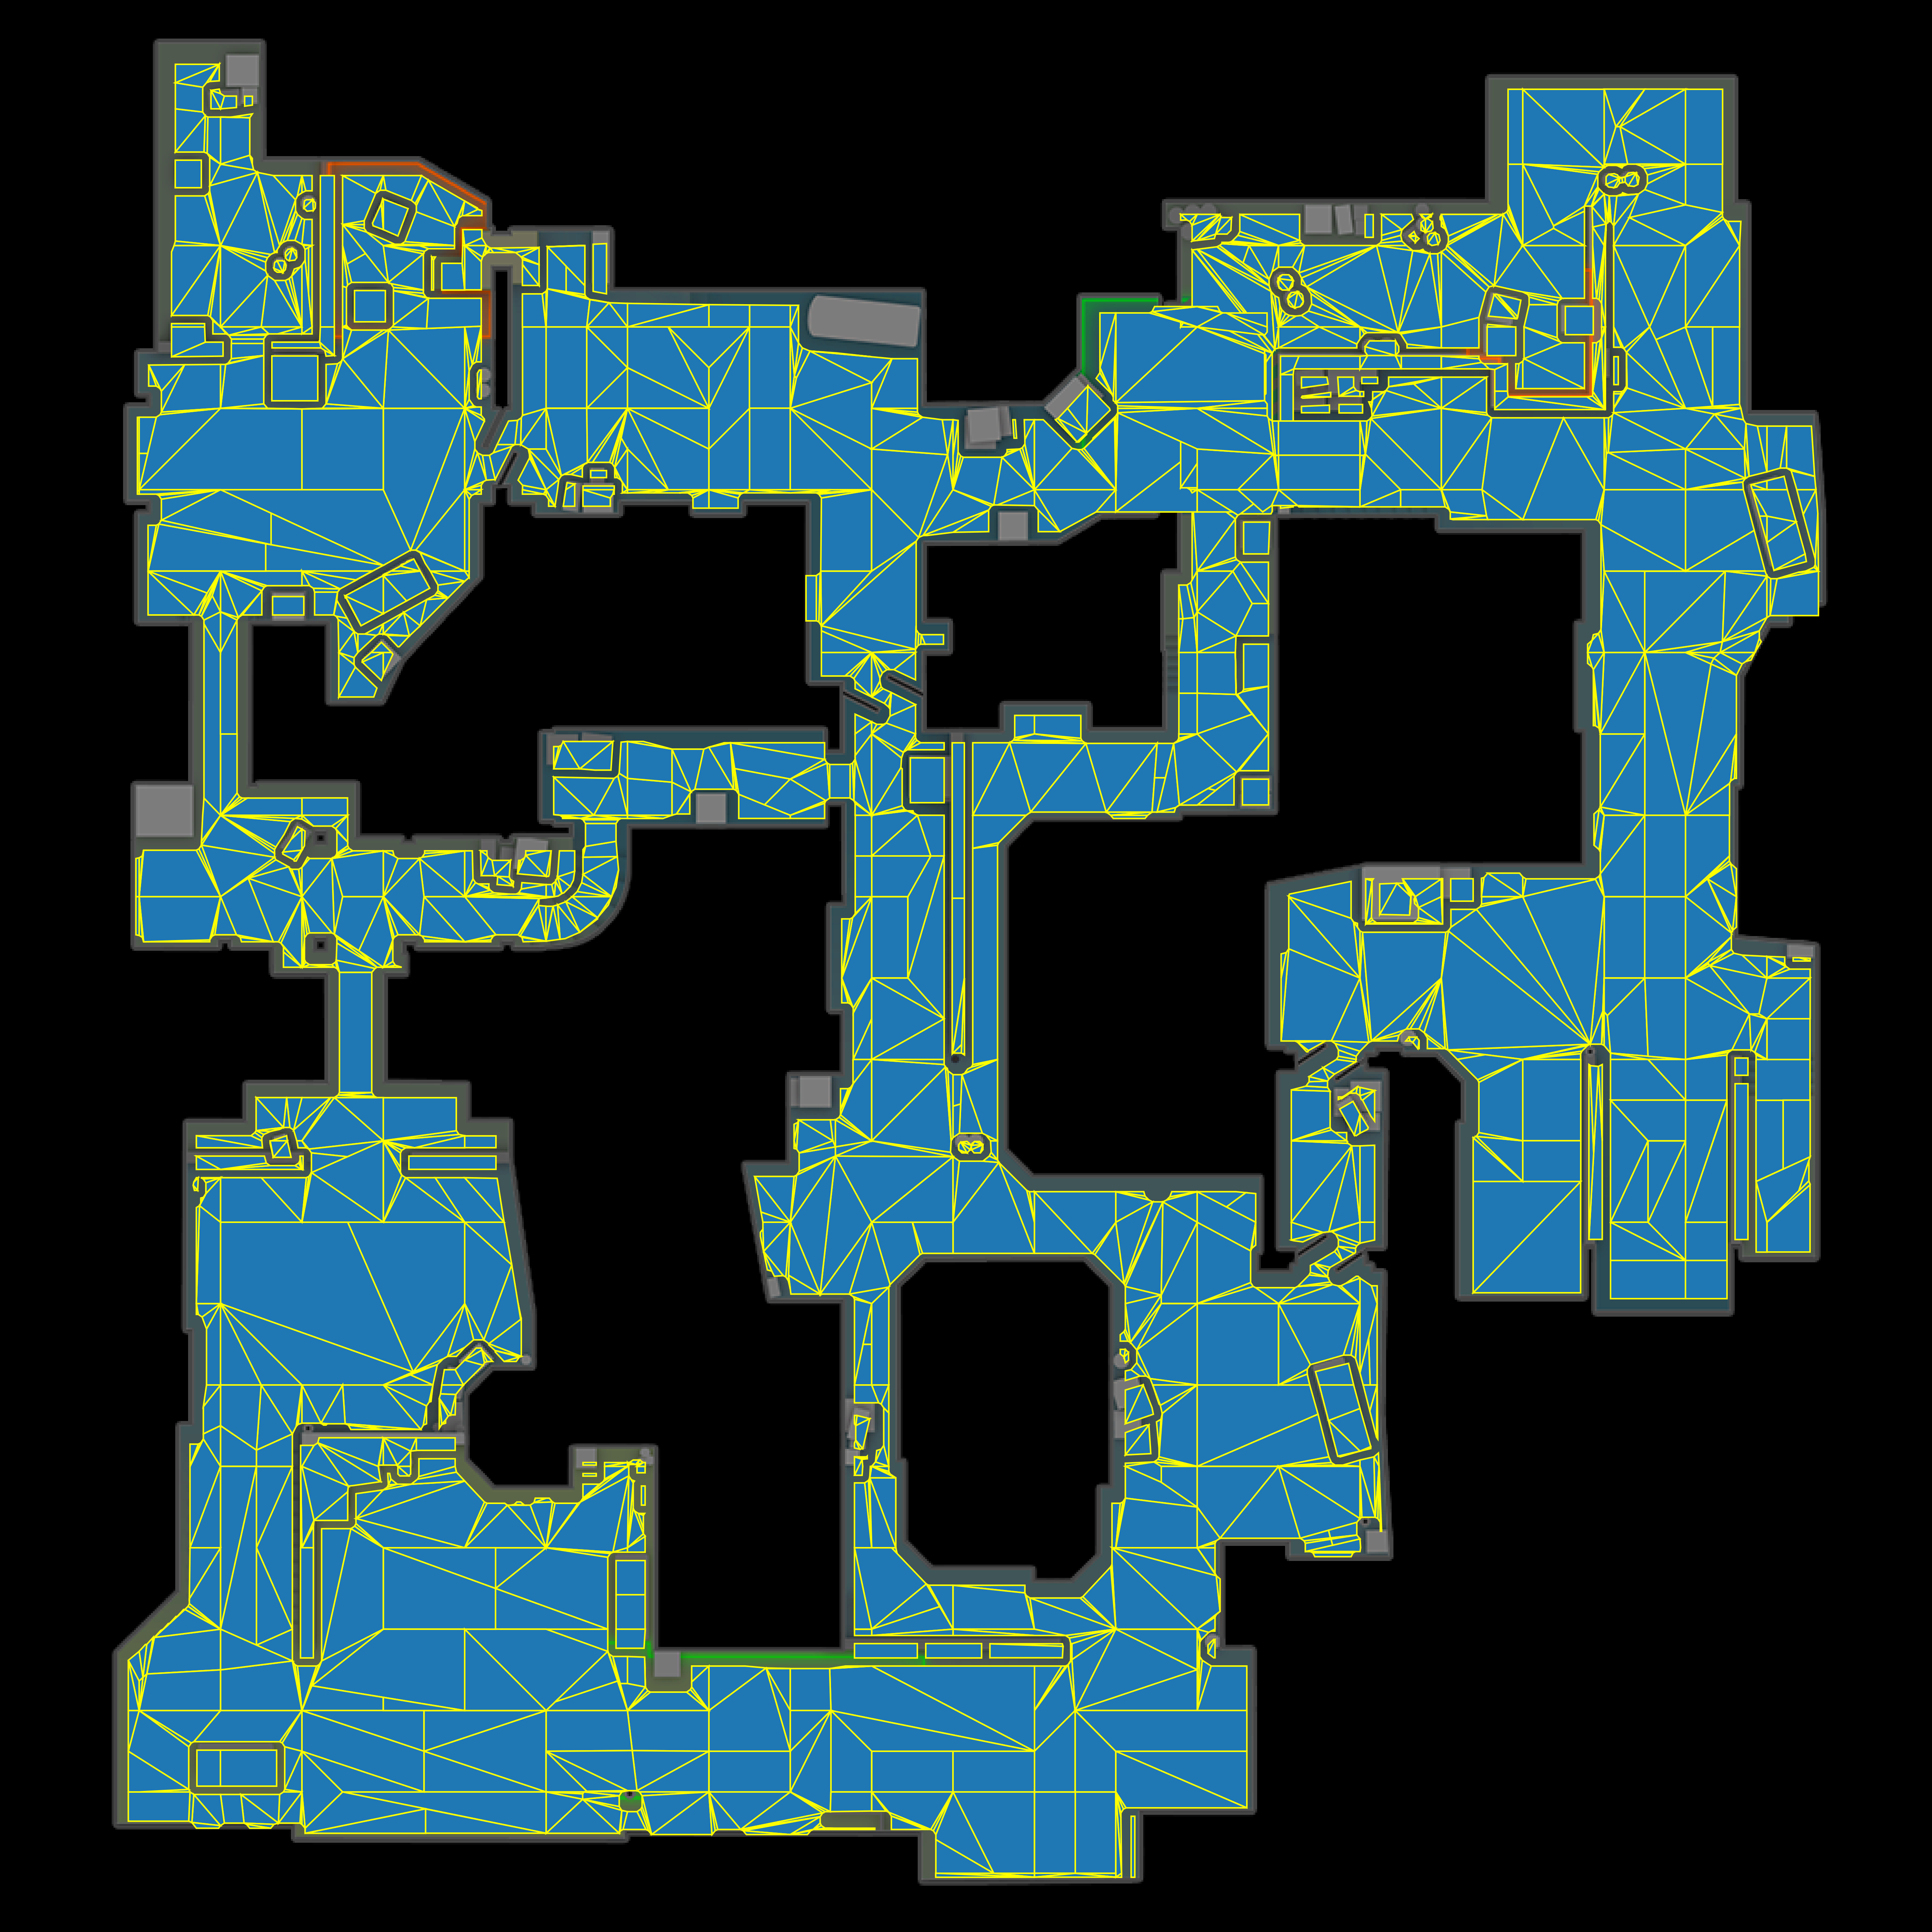
Visualize All Nav Mesh Tiles
[ ]:
'''
In this cell we will visualize all the nav mesh tiles on de_dust2
'''
import awpy.plot.nav
awpy.plot.nav.plot_map_tiles(map_name="de_dust2")
(<Figure size 5700x6300 with 1 Axes>, <Axes: >)
Save All Nav Mesh Visualization to File
[4]:
'''
In this cell we will visualize all the nav mesh tiles on de_dust2
and save the resulting graphic to file
'''
from pathlib import Path
save_dir = Path("./tmp/sample_img.png")
awpy.plot.nav.plot_map_tiles(map_name="de_dust2", outpath=save_dir)
2025-03-02 16:35:34.491 | DEBUG | awpy.plot.nav:plot_map_tiles:173 - The visualization has been saved at C:\Users\pnxen\Documents\awpy\docs\examples\tmp\sample_img.png
[4]:
(<Figure size 5700x6300 with 1 Axes>, <Axes: >)

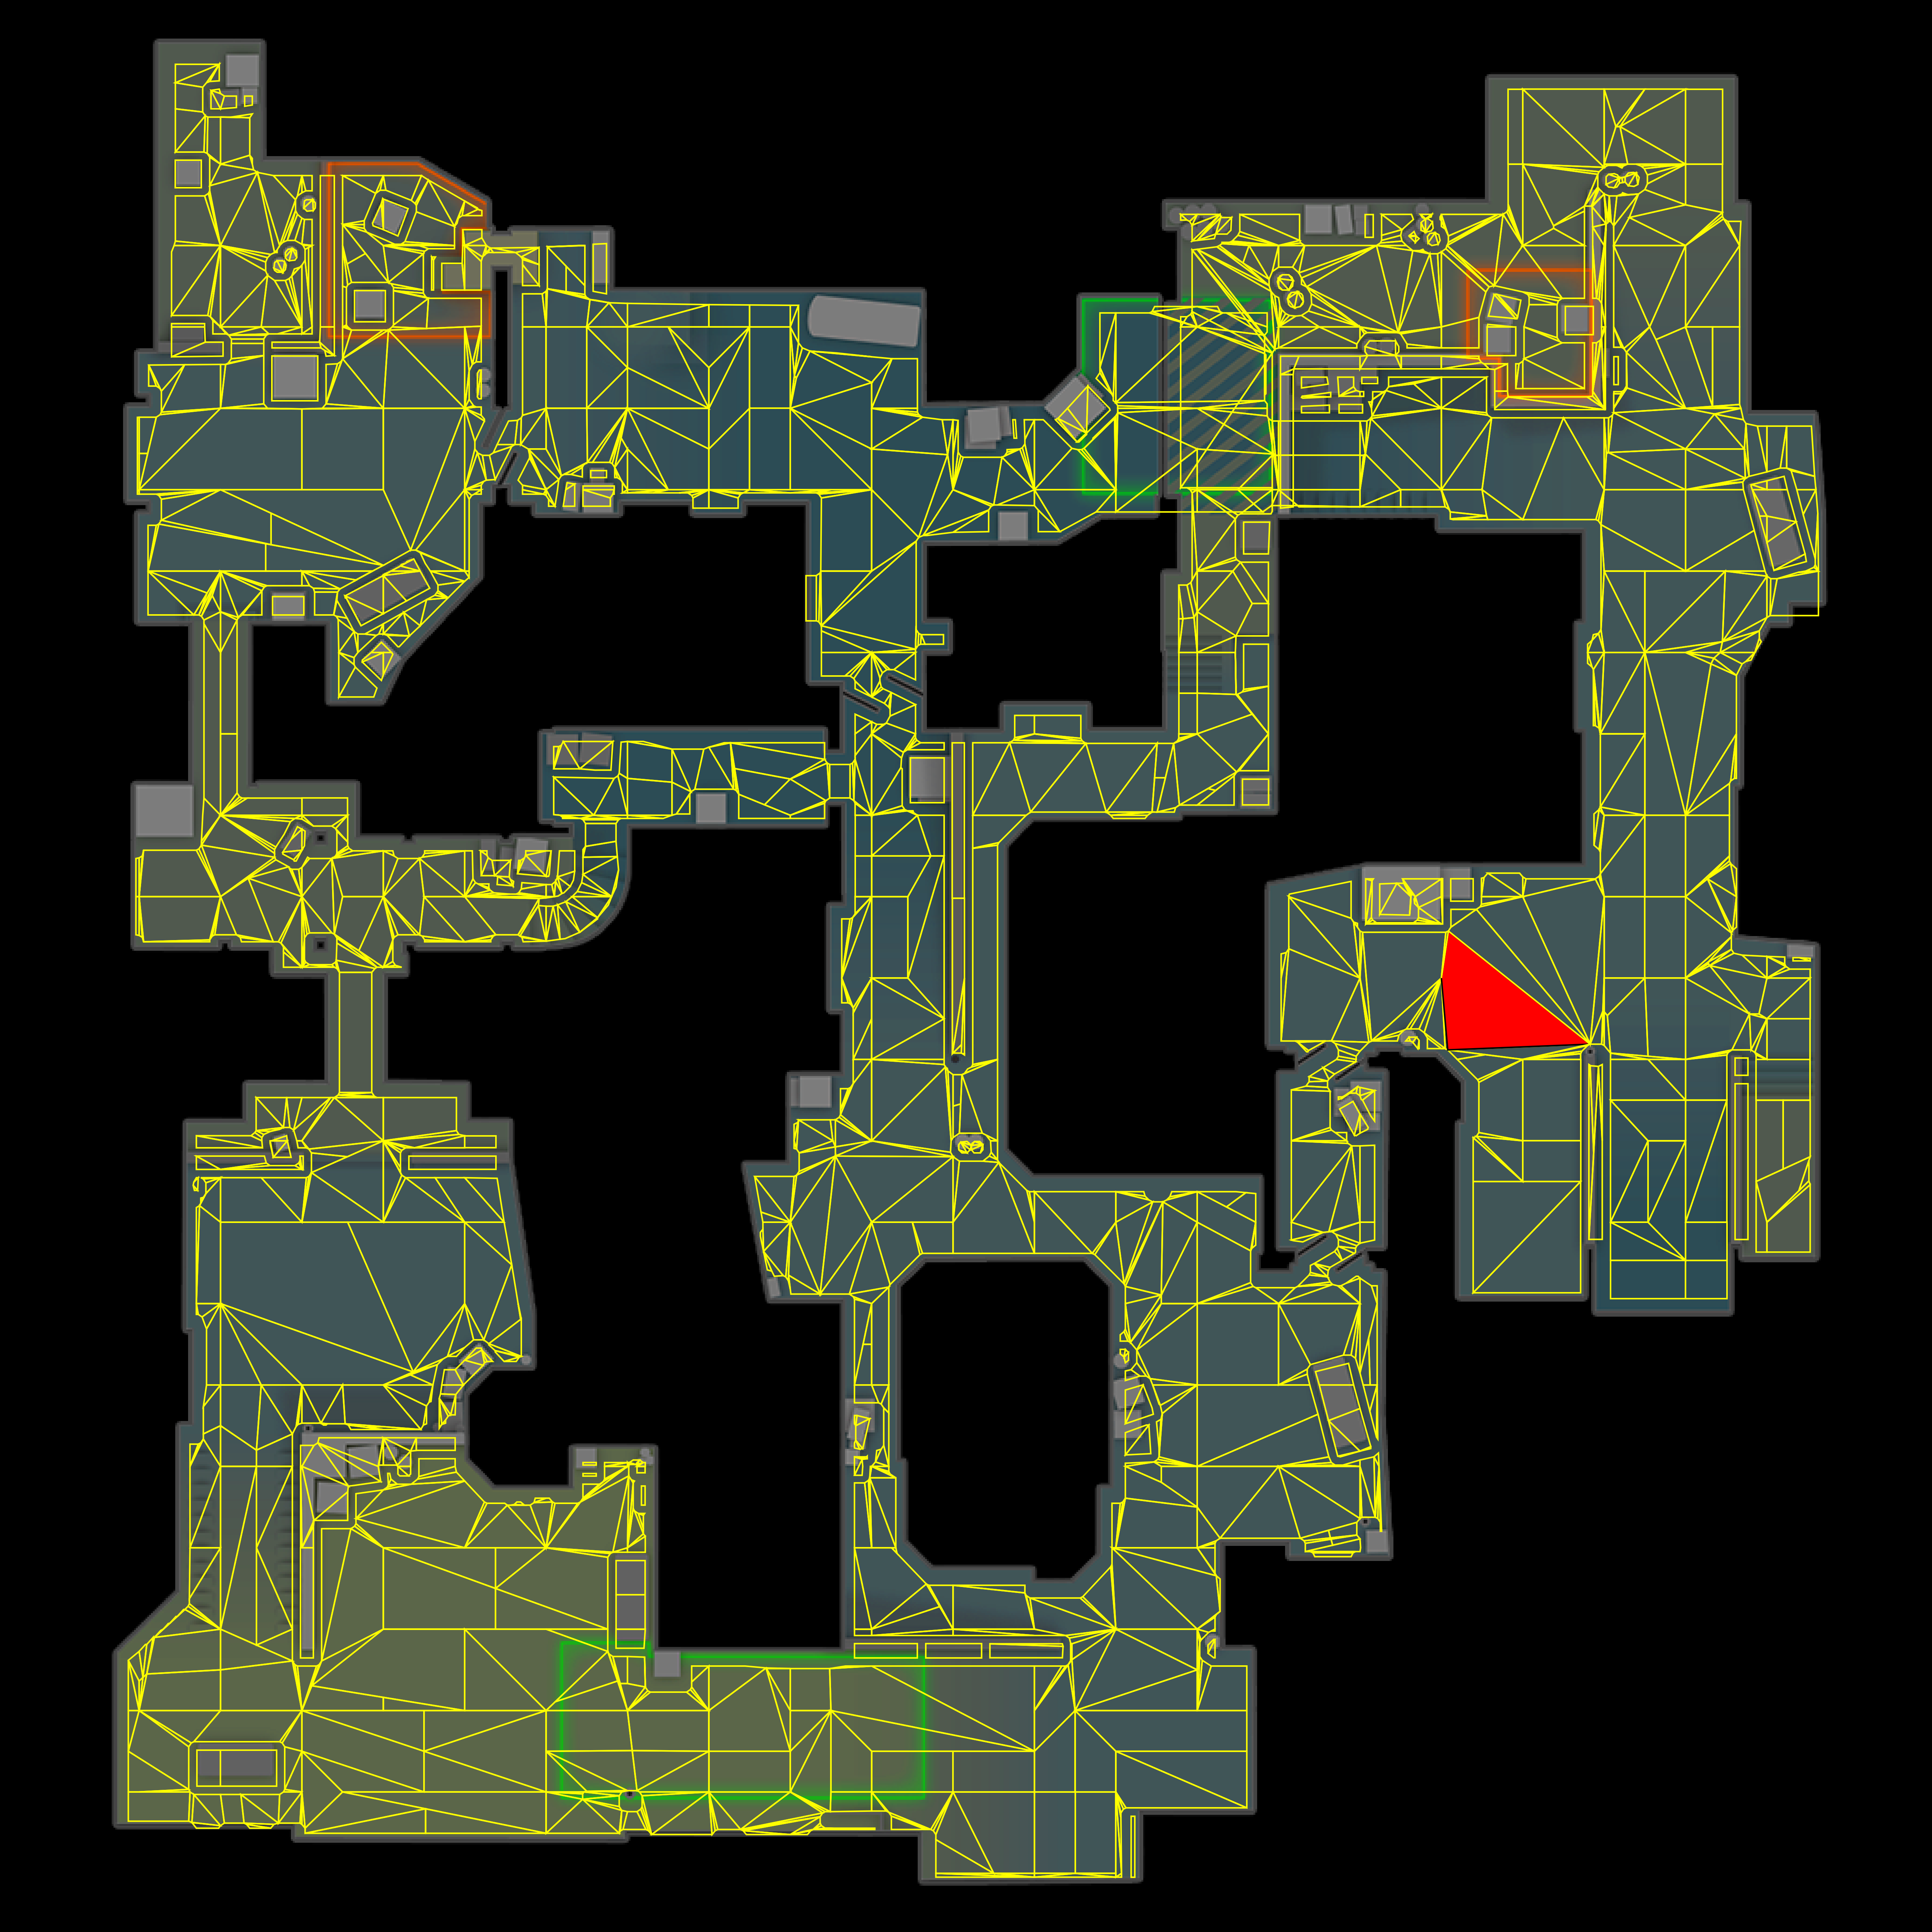
Visualize Selected Nav Mesh Tile(s)
[8]:
'''
In this cell we will visualize a nav mesh tiles (512 on de_dust2)
'''
viz_map_name = "de_dust2"
tiles_to_visualize = [512]

awpy.plot.nav.plot_map_tiles_selected(map_name=viz_map_name, selected_tiles=tiles_to_visualize)
[8]:
(<Figure size 5700x6300 with 1 Axes>, <Axes: >)

[7]:
'''
In this cell we will save the individual nav mesh tile visualization
to file
'''
viz_map_name = "de_dust2"
tiles_to_visualize = [512]
save_dir = Path("./tmp/sample_img2.png")

awpy.plot.nav.plot_map_tiles_selected(map_name=viz_map_name, selected_tiles=tiles_to_visualize, outpath=save_dir)
2025-03-02 16:36:12.223 | DEBUG | awpy.plot.nav:plot_map_tiles_selected:238 - The visualization has been saved at C:\Users\pnxen\Documents\awpy\docs\examples\tmp\sample_img2.png
[7]:
(<Figure size 5700x6300 with 1 Axes>, <Axes: >)
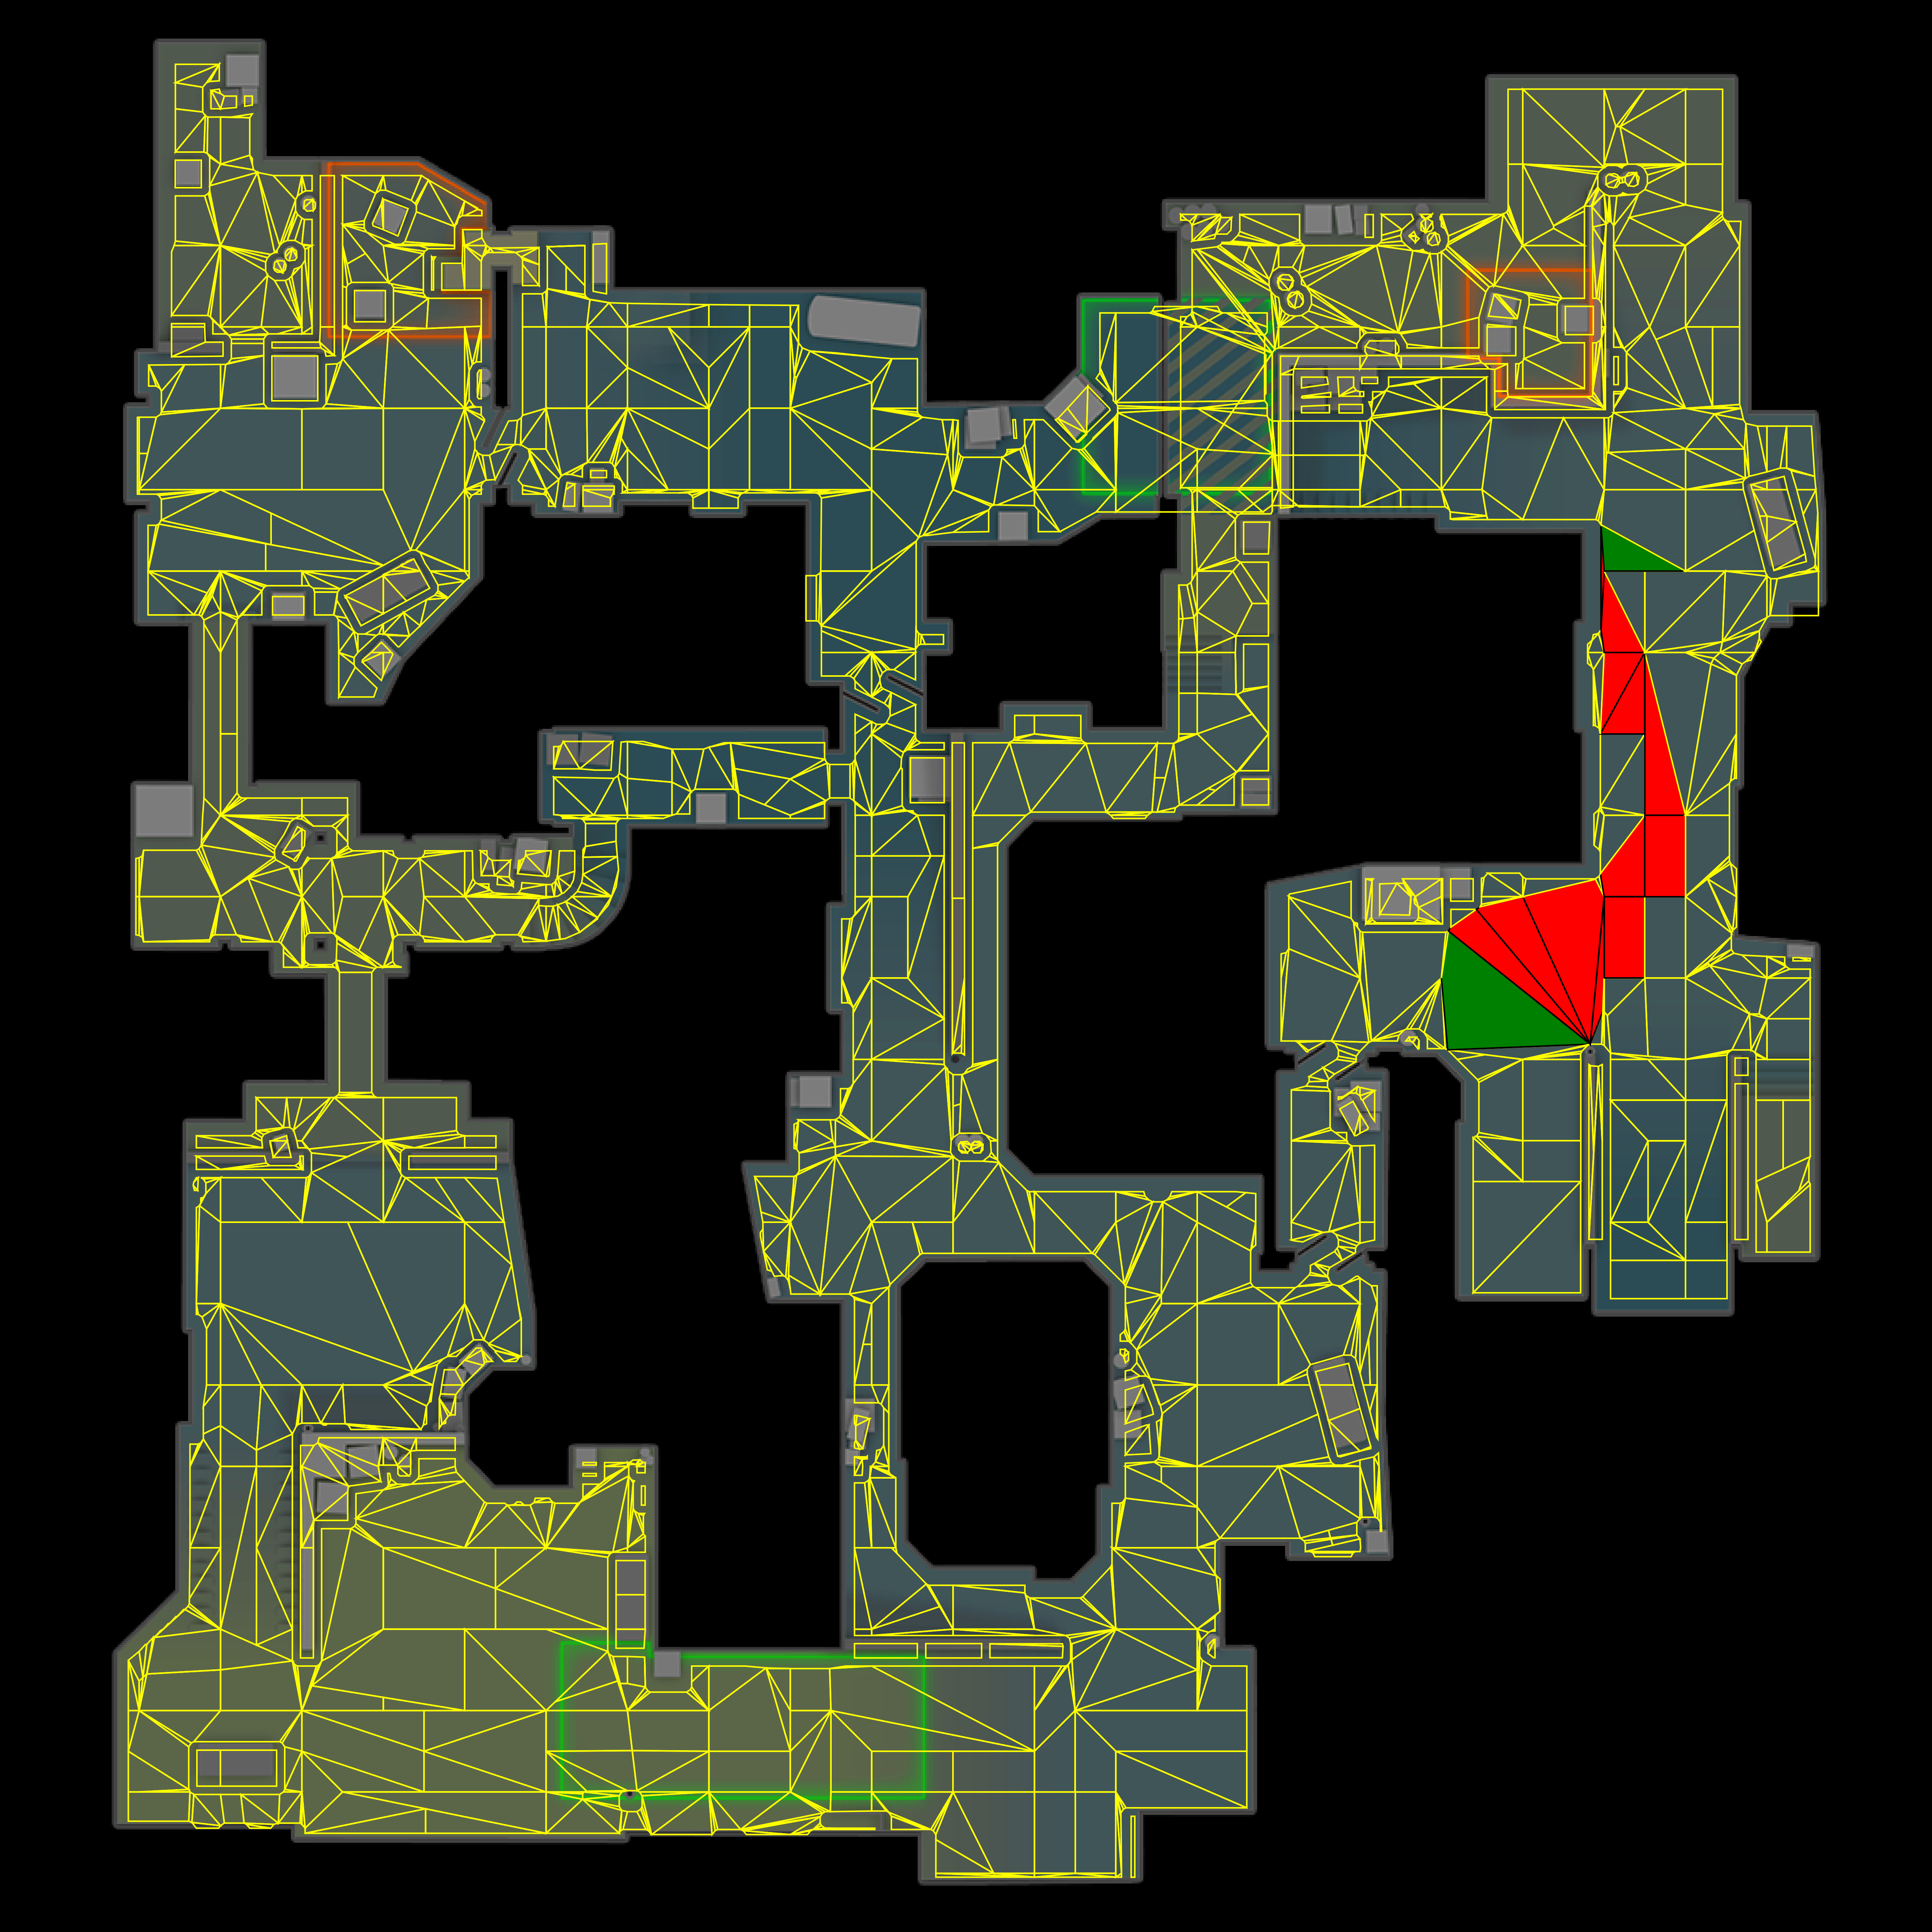
NavArea Path Visualization
[10]:
'''
Here we will visualize the previously calculated path between two tiles on dust2: 512 and 1430.
The source/destination tiles will be colored in green with black edges while all other tiles
in the path will be colored in red with black edges.

To call the visualization function we will need to extract just the area_id for each NavArea object
in the found path.
'''

tile_path = dust_2_nav.find_path(512, 1430)
tile_path_ids = [tile.area_id for tile in tile_path]
viz_map_name = 'de_dust2'

awpy.plot.nav.plot_map_tiles_selected(map_name=viz_map_name, selected_tiles=tile_path_ids)
[10]:
(<Figure size 5700x6300 with 1 Axes>, <Axes: >)
[11]:
'''
We can also save this visualization to file. Pass in a directory as a Path object to the
output_dir argument in plot_map_tiles_selected and the visualization will be saved in that directory
'''

save_dir = Path("./tmp/sample_img2.png")
awpy.plot.nav.plot_map_tiles_selected(map_name=viz_map_name, selected_tiles=tile_path_ids, outpath=save_dir)
2025-03-02 16:36:52.931 | DEBUG | awpy.plot.nav:plot_map_tiles_selected:238 - The visualization has been saved at C:\Users\pnxen\Documents\awpy\docs\examples\tmp\sample_img2.png
[11]:
(<Figure size 5700x6300 with 1 Axes>, <Axes: >)
